|
|
|
|
|
|
10 demographic trends that are shaping the U.S. and the world https://t.co/UGktxxuWkl pic.twitter.com/DQsb8wpNAA
— Pew Research Center (@pewresearch) April 29, 2016
Teen birth rate, preg rate, abortion rate & racial/ethnic gap in teen births way down.
— Gretchen Livingston (@DrGMLivingston) May 2, 2016
Why? https://t.co/2efWJr5tdG pic.twitter.com/1LnP6d9YwB
|
|
|
New https://t.co/nrwBwQwHkn study reveals new insights into older Americans’ working and #unretirement trends. pic.twitter.com/lIzy1RZq4E
— AP-NORC Center (@APNORC) May 10, 2016
|
|
|
|
|
|
Good insight on 20th cen. E.Euro history. Push factors, migration to US, Jewish resettlement, Communism, & EU #APHG
|
|
|
|
|
|
|
|
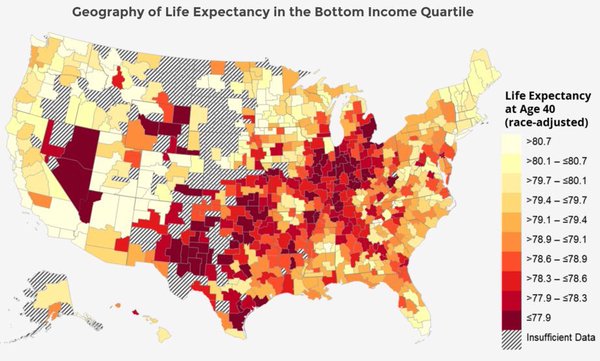
Rural life expectancies are dropping in the US. The causes for this decline.?
Fewer economic opportunities Low education rates High smoking rates Obesity Drug/alcohol abuse How does adjusting for race affect this data? Race-adjusted means that controls for the effects of differences in population race distributions. When comparing across geographic areas, some method of race adjusting is typically used to control for the influence that different population racial distributions might have on health event rates. |
|
The Sunbelt is happy and the Rustbelt is not □ https://t.co/Jzo2pPTFKx
— Coach Williams (@aphg_coach) May 4, 2016
